

Request access
What is Performance Monitoring?
Developing an amazing product is only part of the job. Ensuring that it works as intended and that it meets your quality standards is a whole other story. It is normal for all types of companies to face observability issues, where it is hard to truly understand the internal states of a complex system. These issues can compromise your ability to measure key performance metrics about the usability of your product and therefore your ability to grow into the next level.
Performance Monitoring is the art of ensuring the quality performance of your services. It involves generating accurate performance data, processing it into actionable information and choosing how to provide this information to agents that can act upon it via dashboards, alerts, reports, etc.
While many modern services provide monitoring metrics right out-of-the-box that you can use for monitoring purposes, as you scale, and if you want to dig deep, you’ll want to create insights that are customized to your service, you’ll need to instrument your code base.
Service Reliability Engineering (SRE), emerged as the state-of-the-art set of practices for monitoring services. Its three main value propositions are:
- Ensuring quality standards
- Mitigate problems before they become incidents
- Allow you to understand where you should focus engineering efforts
In this article we’ll be going over how to instrument your code-base with an SRE mindset using Prometheus, which is one of the industry standards tools for system monitoring. We’ll be dividing this into two sections: the first will inform you about what data you’re trying to generate and why; the second will provide a high level introduction to Prometheus and elaborate about how you can easily achieve what was described in the first part.
The SRE mindset
Building Service Level Indicators (SLIs) From Scratch
The reliability stack that’s at the core of SRE is made up of three core concepts: Service Level Indicators (SLI), Service Level Objectives (SLO) and Error Budgets. These are built on top of each other, by this order. There are a lot of resources on the web about these, and if you wish to get familiar with the technicalities behind them you can check our article In-depth guide on SLIs, SLOs and Error Budgets. Here we’ll be focused on creating the most meaningful service level indicators from instrumentation events.
An SLI measures the ratio of events that fulfill your quality standards. Therefore the first thing you need to do is conceptually define your quality standard. That simple act automatically labels every event that occurs in your platform into one of two labels: either good or bad which then allows you to see over time how your system is behaving according to how you expect it to. You can have quality standards for different aspects of your services, as there are different reliability aspects that you want to ensure. This is an abstract framework that can be applied to a variety of situations, regardless of which industry you’re involved in:
- Are you a UI/UX expert trying to ensure a premium user experience ? Then your quality standard involves ensuring that users barely see loading screens and that your webapp doesn't crash under any circumstance.
- User interactions where the webapp loading screen lasted less than a certain amount of time could constitute a good event.
- Occasions where your users successfully completed a user journey and didn’t abandon it could constitute a good event.
- Are you a developer building a payments processing service? Then your quality standard probably involves ensuring that each payment request that’s correctly submitted by the user is properly processed within a certain amount of time.
- Payment requests that were processed correctly could constitute a good event.
- Payments that were processed below a certain amount of time could constitute a good event.
- Are you a system administrator maintaining a streaming service? Then your quality standard involves ensuring that each sent packet is received at a reasonable amount of time and that your stream’s throughput is at a scalable rate.
- Packets that were sent and properly received within a certain amount of time could constitute a good event.
- Time spent where your throughput rate is above a given value could constitute a good event.
And so on, and so forth. With the quality standard defined, it’s only a question of instrumenting your user journeys in order to measure the amount of good and bad events, produce an SLI and measure the evolution of your indicator over time. What gets measured gets managed! Furthermore, you can then leverage the SLI and create objectives for your services, track how well you’re doing using Error Budgets and be notified if something's broken via burn rate alerting. But hang on, we’re getting ahead of ourselves!
The Red Method - Key Metrics For A MicroservicesS Architecture
So now, assuming that you conceptually understand what an SLI is, let’s go over which ones are the most important to build first. Hopefully, as your monitoring range grows with time you’ll extend your portfolio of SLIs to cover different granularity levels and increase the observability of every core transaction that occurs in your system down to the finest detail. But to get to that stage you must start somewhere, and for many that’s what the RED method is for, which is mainly focused on the microservice architecture.
The method’s name derives from the names of the key metrics that should be measured in each microservice:
- (Request) Rate - The number of requests the service is handling per second.
- (Request) Error - The number of failed requests per second.
- (Request) Duration - The amount of time each request takes.
The number of requests lets you know the traffic that is going through your service, the portion of those requests that lead to errors informs you about how well your service is performing and the time duration about the efficiency and latency of your service. These provide a fine understanding about the performance of your service.
Of course you can dig deeper, and create more metrics about different aspects of your service. Throughout, freshness, correctness, CPU/Memory usage are other measurements that can be relevant depending on the type of service you’re dealing with. If you want to read more about this, we recommend Google’s article on monitoring distributed systems, which is the RED method’s next iteration.
Now, with a fine understanding of where we want to get, let’s get our hands dirty with some Prometheus examples in the second part of the article!
Using Prometheus to instrument your service
Prometheus allows you to effortlessly generate data throughout your code-base to generate insightful metrics. Once you know its basics, it’ll be relatively easy to apply the RED method to any of your services. Prometheus has been extensively explained in many other articles and we won’t go over every small detail here, but just to cover the basics. There are 4 kinds of metrics than you can create:
- Counters - a cumulative metric that can only increase or reset (You can use a counter to represent the number of requests served, tasks completed, or errors)
- Gauges - a numerical value that can arbitrarily go up and down
- Histograms - samples of observations that can be configurable into buckets according to its raw value
- Summaries - samples of observations that can be configurable into buckets according to its quantiles
You’ll only need two metric types in order to fully implement the RED method, them being counters (to keep track of your requests and errors), and histograms (to measure the duration). Another concept that's important for you to understand is the way Prometheus identifies its metrics, through labels. Labels are key-value pairs that together with the metric’s name identify a unique time-series. This is the industry’s standard because it allows for a very precise yet modular data structure that eases aggregation and decoupling according to many different dimensions. Notice the following example, with metric name source_requests_total and the label keys env, job, source, monitor, service, instance, task_arn.

Let’s jump into a practical example using Python, which hopefully makes it easier to understand. For this we’ll be using the official Python client for Prometheus. Imagine that you’re an engineer tasked with measuring the performance of your company’s payment processing service, which looks something like this:
It’s a complex service in the background but if you really think about it its main workflow is pretty vanilla: You try to perform a certain job, if you fail with a known error, you handle it and return an error (-1 in this case), otherwise you just log it and re-raise the exception so another level of your code-base can handle it. This logic allows for three mutual exclusive final states:
- Either the service terminates successfully
- Or it fails, but it is doesn’t break execution
- Or it fails miserably, while raising an exception and breaking execution
Let’s create a general Prometheus logging function that covers all three states, but first we start with our imports and by initializing the three metrics we wish to measure:
Then, we can already define the functions that feed data into these metrics, as well as the label values that characterize them.
Now, regarding the actual instrumentation logic: while not mandatory, it is a good practice to keep your instrumentation code as abstracted from your actual service code as possible, in order to avoid undesired entanglements and dependencies. Instrumentation should be a silent observer that isn’t felt and doesn’t interfere, yet it captures the desired details of your service’s performance so you can act upon this data. As such, we’ll make use of python decorators which serve as a nice abstraction layer that extends your code’s capabilities.
There’s a lot happening here, so let’s explain it bit, by bit.
- We start with our logging function, the prometheus_logger that simply calls the previously defined logic to emit metric events according to whether there was an error or not.
- Then we have our error_validator that decides whether the response returned by our service constitutes a success or not.
- And finally we have our python decorator instrumentation_log that provides a wrapper to our service. It basically just calls whichever function is decorating (received as the target_function) and then applies some simple logic to decipher which Prometheus events it should emit.
Applying our instrumentation to our service is then only a matter of adding a single line of code above our service’s main function: as clean as that, perfectly abstracted.
By enabling some more complex labeling and by adapting the error_validator function to each particular use-case, this logic can easily be re-used to cover any scenario where you want to apply the RED method to.
Your first SLI
It's time to take it home! Assuming that you have set up your Prometheus instance and that you’re collecting your instrumentation metrics (we won’t go into much detail here about, as it would fall outside the scope of this article but there are lots of resources that can help you with that), you are now ready to set up your first SLI. You can actually just sign-up into your detech.ai workspace and be done with this in a few seconds. This is what we’ll use to show-case to you what insights you could generate.
So this is what the instrumentation end-goal looks like:
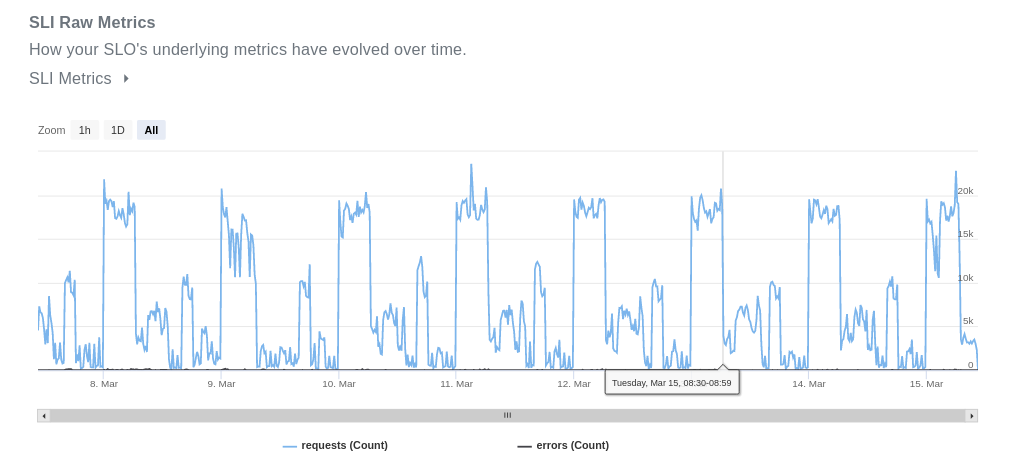
Don’t be fooled! The errors are there, they just look way too tiny, when compared to successful requests. If we hide the requests' metric, you can clearly see them.
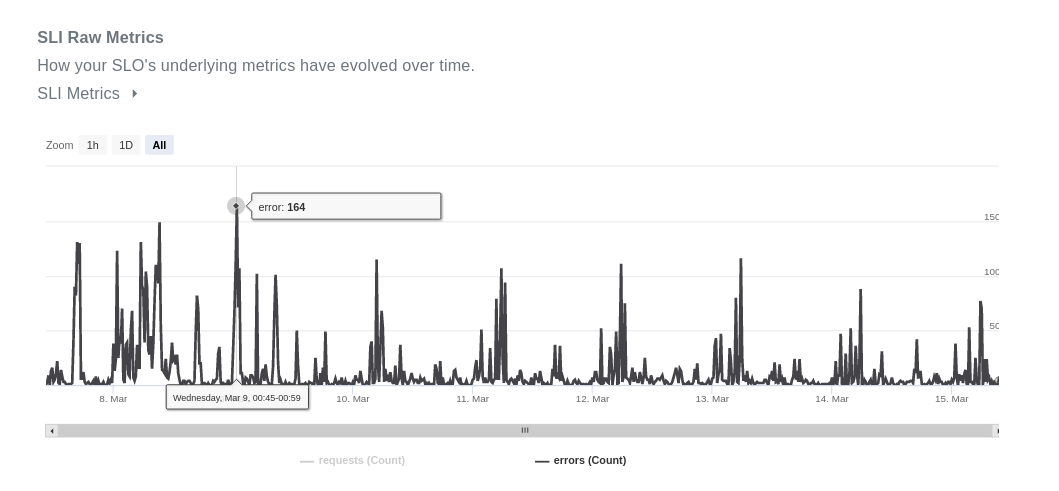
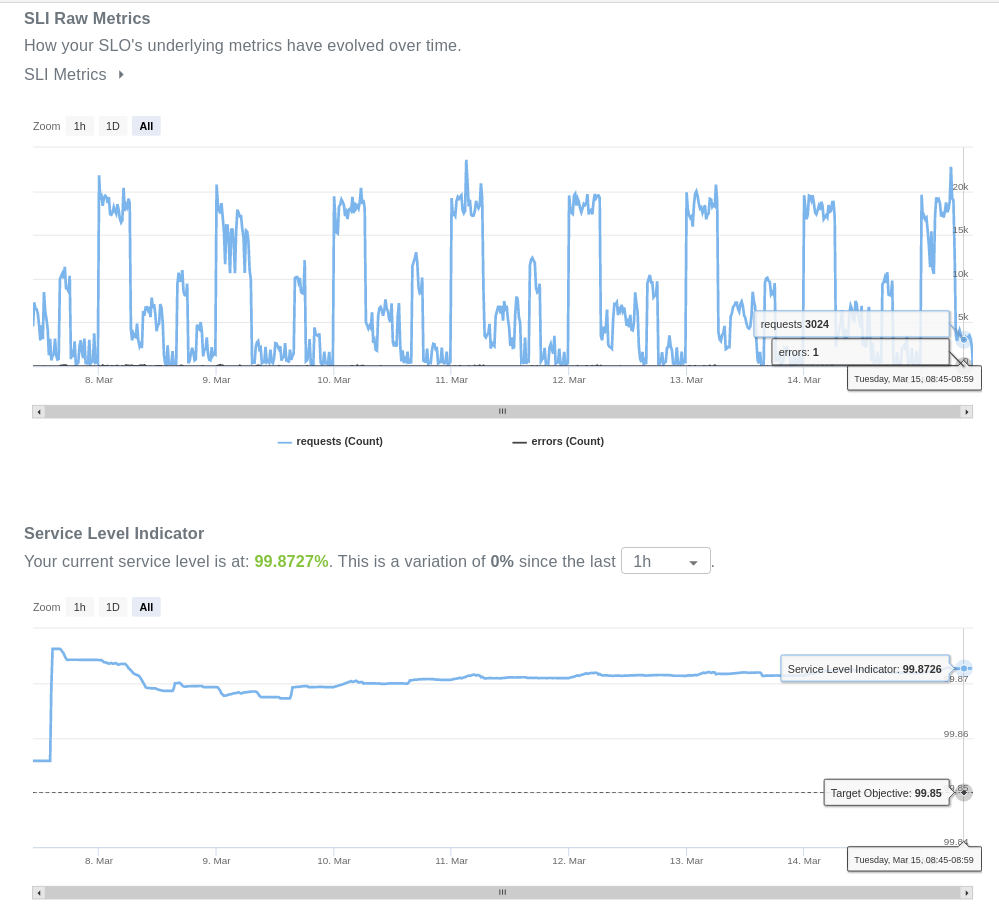
We then use these two beauties to calculate the underlying SLI, which can be seen below. What are you looking at exactly? As mentioned, the SLI is simply the proportion of good events over valid events for a given period of time. For this example, we chose a rolling window of 7 days, which means that each SLI measurement uses event data of the last 7 days. As good events occur, the SLI increases towards 100%, as the amount of errors increases, the SLI is pushed towards zero. It’s simple, yet effective.
Outages, where severe incidents take down your system are marked by a sudden decrease of your SLI, as errors flood in. Bugs or poorly implemented parts of your code that break for some edge-cases are more silent but can be identified by the continuous occasional drop of your indicator.
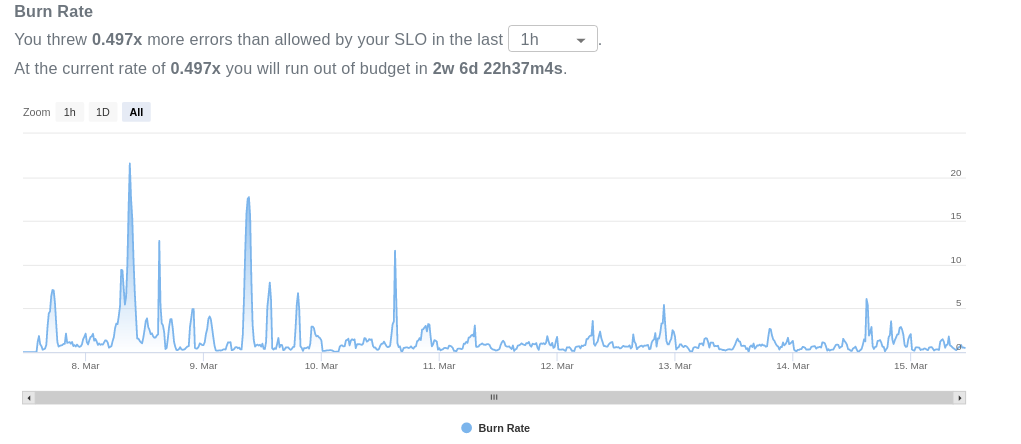
This little chart can be the first brick of your monitoring journey that provides the window of observability your organization is craving for. As mentioned before, this is actually just the beginning of a vast sea of possibilities, there are other SRE concepts that are built on top of your SLI: you can set up objectives based on your quality standards to monitor how close you are to breaking them, which implicitly creates a budget for the amount of errors that you are allowed to endure.
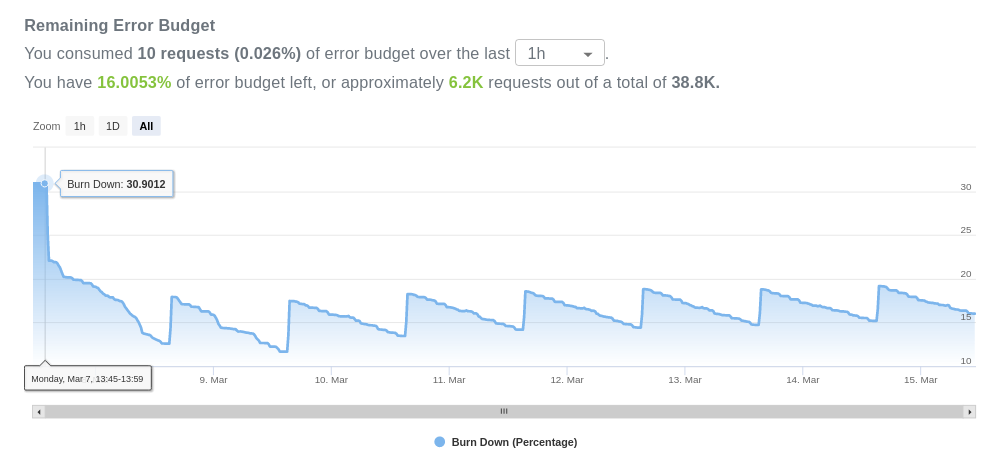
This allows you to also know how fast or slow you are consuming the budget and make appropriate decisions beforehand, which you can also use to set up alerts and be notified whenever stuff starts to break.
We at detech.ai are here to make your life as easy as possible and help you throughout your SRE journey. You handle the instrumentation, we handle the monitoring.
References
Best Practices for Setting SLOs and SLIs For Modern, Complex Systems
Resilience First: SRE and the Four Golden Signals of Monitoring
“Real-World SRE The Survival Guide for Responding to a System Outage and Maximizing Uptime” - Chapter 2: Monitoring, by Nat Welch

See related articles
Introducing Dashboards

.png)
The definitive guide for engineering teams to improve their Developer Experience (DevEx)

%20uses%20Rely.io.png)
How a Reliability Champion (SRE, DevOps, etc.) uses Rely.io